Arts Analytics: Tracking Technology

For this Arts Analytics post I wanted to see what sorts of tracking technology arts organisations are putting on their sites.

Don’t worry it’s not going to get too technical, but this post should provide a decent jumping off point if you’re new to this sort of thing.

By way of introduction, you remember those hit counters on websites you used to see everywhere back in the day? Once upon a time that was about as fancy as it got when it came to tracking website visitors. Nowadays, of course, it’s a totally different story.

There are all sorts of third party apps that you might find on a website, with two broad uses:

  1. Collect data about website visitors – where they came from, what they do on the website, whether they buy anything; and/or
  2. Add functionality to the website – live chat, social media integration, advertising, etc.

In both cases, the most common reason the organisation has put the tracking tech there is to serve the website visitor as well as possible. Nobody does this for the fun of it (although it’s not uncommon to see people collecting data without making full/any use of it).

Naturally enough, the vast majority of the companies providing this technology are doing it for the money. They get paid in one of two ways:

  1. The organisation wanting to make use of the technology pays for it directly; and/or
  2. The technology company captures data about website visitors so they can sell that data to other businesses (mostly third party advertisers).

So, with all that being said, how do we find out who’s using what?

Method

I installed a free browser extension called Ghostery, visited the homepages of the 100 organisations in my sample group and jotted down the tracking technologies it flagged up.

Ghostery

Here’s some info about Ghostery:

Ghostery is a browser extension – which means it’s an app you can add to your web browser or mobile phone/tablet – that shows you all the companies that are tracking you when you visit a website. Ghostery lets you learn more about those companies and the kinds of data they collect, and block them from collecting data, if you choose.

Ghostery currently detects 1,927 different apps. They have a company directory here if you’d like to look up anything mentioned in this post.

Here’s what I found. Organisations are sorted by the number of tracking apps found. It scrolls a looong way sideways, sorry about that.

Data was collected on 24 August 2014.

Results

Here are some headlines:

  • Every organisation has some sort of tracking technology on their websites.
  • Every organisation is using a technology that gives some data to third party advertisers.
  • 70 different technologies are represented (of the 1,927 currently listed by Ghostery).
  • Google Analytics is the most popular, used by 99% of the organisations (you can see for yourselves which one is flying blind).
  • 30% are only using Google Analytics.

 Organisations with the most tracking tech on their websites

  1. Hampstead Theatre (21)
  2. London Symphony Orchestra (14)
  3. New Wolsey Theatre (11)
  4. English National Ballet (10)
  5. Sadler’s Wells (10)

Hampstead Theatre - Ghostery

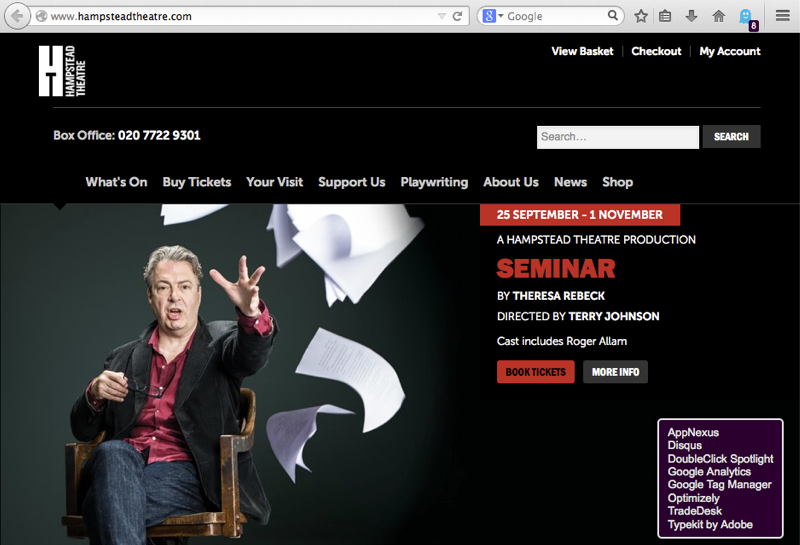
The eagle-eyed amongst you will notice that Ghostery only found eight tracking apps on the Hampstead Theatre website when I came to take that screenshot. I collected the data for this post a couple of weeks ago, so it’s very possible things have changed since then. Same goes for the other sites. Science, eh?

The most widely used tech

  1. Google Analytics (99)
  2. Twitter Button (27)
  3. Facebook Connect (20)
  4. New Relic (19)
  5. DoubleClick (15) and Facebook Social Plugins (15)

Some thoughts

There’s a lot of technology in use out there. Some of it’s really useful and well worth including on a website. There are also good reasons for going easy with this stuff:

  • Pragmatism: it’s a lot to manage and to inform users, plus it can slow your site down.
  • Ideology (for want of a better word): website user data probably shouldn’t be traded recklessly.

The reality is that very few arts organisations will be thinking ‘Hey, let’s hit our website visitors with loads of tags, pixels, cookies and anything else we can throw at them’. They’ll put Google Analytics on there, then a Twitter badge to help bump up their follower numbers. Then their ad agency will ask to put a tracking pixel on the site so they can see how well their advertising is working. Another agency will do the same. Oh, and a live chat function would be good for helping users… Before you know it, there’s tracking tech all over the place.

I’ll leave you with a few tips:

  • Understand what’s on your site. At the end of the day, your website is your responsibility.
  • Ask yourself if you need it all on there.
  • By the same token, ask yourself if there’s something you maybe should be doing, but aren’t.
  • If you’re going to load up on tracking tech then take a look at what a tag management service could do for you. Google Tag Manager is free and has some additional benefits if you’re using Google Analytics (which you probably are).
  • Do your privacy or cookie policies mention any of this stuff? Maybe take a look.

Something I can’t help thinking – imagine what these Arts Analytics posts would be like if I had access to all that data.

One last thing, if this post was of interest, then take a look at the Southbank Centre’s Web We Want Festival which kicks off at the end of this month (Sept 2014). There’ll be all sorts of discussions about the kind of web that we’re making for ourselves.

[hypha_alert style=”green”] Please take a second to share this post if you liked it. Click here to tweet it. [/hypha_alert]

[hypha_alert style=”white”] See the rest of the posts in the Arts Analytics series. [/hypha_alert]

Arts Analytics: which arts organisations are on Instagram?

Instagram has taken off like crazy, built by a small team and acquired by Facebook for big bucks. It’s also a platform that ticks the boxes of a few very prominent trends – mobile-first, visual-led and driven by the creativity of its users.

For this post in the Arts Analytics Series I wanted to see:

  • which arts organisations have been experimenting with it,
  • who’s using it the most; and
  • who’s getting the most traction.

Taking my sample group of 100 organisations, I looked up their Instagram accounts and then pulled out their key stats into a spreadsheet. Firstly, though…

How to find Instagram accounts

This gets a sub-heading of its own, because searching for accounts on Instagram is a pain. To find the accounts I tried these three things:

  • Searching on Iconosquare – a third party Instagram tool.
  • Googling the name of the organisation plus Instagram.
  • Looking on the organisation’s website. Sometimes there are social media logos in the footer (or elsewhere). This was a last resort, but it did work in a couple of instances.

If I missed any accounts then please let me know. I think I did pretty well, but reckon one or two might’ve passed me by (and please make sure you make your account easy to find).

Here’s the data, sorted by the number of followers:

Data was collected on 18 August 2014.

Findings

  • 55 of the 100 organisations in my sample group have set up Instagram accounts.
  • The ratio of followers to following doesn’t seem to indicate anything at all.
  • There’s some correlation between the number of followers and the number of photos posted, but it’s a bit sketchy.
  • Galleries seem to be disproportionately popular at the moment.

Serpentine Gallery Instagram

The organisations with the most followers

  1. Serpentine Gallery (23,442)
  2. Royal Opera House (17,583)
  3. Barbican Centre (16,688)
  4. English National Ballet (10,893)
  5. The Photographers’ Gallery (8,456)

Why are they so popular? Well, it’s not going to be down to one single thing, but here are some factors:

  • They put the effort in. They’ve each posted quite a few times (although ENB not so much) and their pics are interesting and attractive.
  • Comparative levels of brand recognition. The Barbican, ROH and ENB are often towards the top of these lists and I’d suspect that has something to do with it.
  • They all have other healthy social media accounts that they can cross-promote from.
  • The Royal Opera House do a great job of tagging their photos with tags that people on Instagram actually use. See http://instagram.com/p/r4qM8BhDVD/. Are #foodgasm and #foodporn very ROH-like terms? Maybe not. Do people use them on Instagram? Heck yeah.
  • In the case of TPG, it won’t have hurt that (a) they’re a photo-centric organisations and that (b) they did an Instagram-themed event at the weekend, although my figures were collected a little before that took place.

The Photographers’ Gallery has also posted the most photos by far quite a long way. Speaking of which…

The five most snap-happy organisations

  1. The Photographers’ Gallery (693)
  2. Royal Opera House (471)
  3. Fact (Foundation For Art & Creative Technology) (367)
  4. South London Gallery (351)
  5. Theatre Royal Stratford East (347)

Although posting a lot of photos doesn’t necessarily translate into lots of followers there does seem to be some sort of correlation. Here’s a graph of followers v photos posted:

Instagram graph - followers vs photos

I took out the orgs with more than 3,000 followers because they made the graph hard to read.

There’s a bit of a trend there, but we’re working with limited data and it’s fairly erratic. I’d say it’s a signal, but not a strong one. I guess the more photos you post, the more often you can cross-promote across other social media accounts and the more ‘alive’ and worth following that account is. The content still has to be good.

Beyond that, the discovery mechanisms in Instagram are currently pretty limited. For instance, just because you’re posting lots of photos and they’re getting a lot of likes or comments, doesn’t mean that friends of your followers will see that. Not in the way that retweets will get you more visibility on Twitter or interactions will increase your chances of showing up in news feeds on Facebook (although that’s becoming a fond memory anyway).

A couple of other observations:

  • A couple of accounts – Headlong Theatre and Theatre By The Lake – are being kept private at the moment.
  • Props to the Craft Council. They racked up 171 followers without posting a single photo. Several orgs have posted more than 100 times and still have fewer followers than that.

Thoughts and conclusions

It’s early days for Instagram and, honestly, it’s probably too early to draw too many conclusions about anything much from the figures I’ve collected. If you’re looking to find what’s ‘normal’ then I don’t think anything particularly coherent has emerged.

However, it’s interesting to see which organisations have started figuring out this relatively new platform.

It’ll be interesting to see what happens with organisations’ use of Flickr from this point. It’s been the platform of choice for storing photos for some time, but it also feels like a less popular destination these days. The two services have very different sets of functionality and so lend themselves to different purposes, so I’ll be watching with mild interest.

By the way, I wasn’t able to look at the number of comments and likes on photos. If anyone comes across a way to do that then let me know. It’d be interesting to see what sort of thing is getting the most traction and to marry those figures up with some of the numbers I’ve collected.

A couple of tips:

  • If you have an Instagram account then please include the name of your organisation in your profile to make you more findable. If you’ve got a blog then maybe mention it there too – it’ll help make your account easier to find.
  • Use #tags. They seem to be one of the principal discovery mechanisms at the moment. Don’t go too nuts though – at least keep them relevant.

Anyone else got some tips to throw in?

By the way, someone requested that I cover Instagram as part of the Arts Analytics series. If you’ve got any requests then just let me know. If I can accommodate it then I will.

[hypha_alert style=”green”] Please take a second to share this post if you liked it. [/hypha_alert]

[hypha_alert style=”white”] See the rest of the posts in the Arts Analytics series. [/hypha_alert]

Thoughts on posters – accents and kerning

I was staring at posters on the Tube earlier today and a couple of them made me think. I didn’t take pics but you’ll get the gist from these screenshots.

Here’s the first one.

Coppelia

I was idly wondering whether that accent in ‘Coppélia’ has any affect on ticket sales.

Could it maybe give people the idea that the production will be hard to understand, more ‘foreign’ and less accessible to an English audience? Might it make people think that they’re less likely to ‘get it’?

If so, is it still worth it from an artistic (or even educational) standpoint to spell the name correctly? It is the character’s name, after all. I’m also all for assuming that people have a modicum of intelligence.

Maybe (probably?) the accent doesn’t make the slightest difference. Still, it’s something that would be interesting* to A/B test if the circumstances ever arose. You could maybe do it via PPC ads, with the title being the only change to the copy across ad units.

What prompted this wondering was a conversion with someone about the way that ballet and opera companies (and it’s mostly ballet and opera companies that do this) sometimes talk about wanting to get more people in to see their productions, but then insist on putting titles in a foreign language. This is a very benign example of a foreign language title, but still.

Here’s the second one, and this is more about getting something off my chest.

Miss Saigon poster

The spacing of the word ‘Miss’ just really annoys me, specifically the gap before the final ‘s’. I know the letters are spaced evenly, but the circle behind the ‘i’ obscures that and throws it all out.

This XKCD comic is relevant to this.

* ok, interesting to me.