I’ve complained before about the digital metrics that Arts Council England collects as part of the annual review. However, I’m aware that that’s not particularly constructive. What I should do is explain why I think the metrics are useless and provide some sort of solution. In fact, a few people have asked me about this and I’ve only ever given half answers.
Here’s an attempt to answer the question properly.
Some background
Arts Council England asks their National Portfolio Organisationsto submit an annual report with all sort of information and figures. As part of that they’re required to provide some digital metrics.
Here’s what they ask for (photo via @SamScottWood):
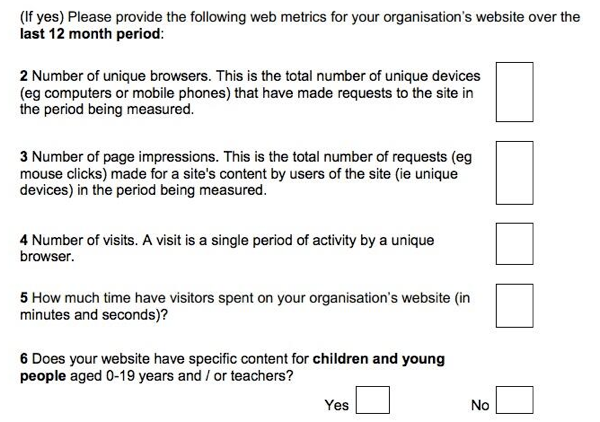
On the face of it, collecting this type of aggregate data is a good thing. As a major funder, ACE is in a position to do two very powerful things:
- Collect data that can inform policy and produce insights that can benefit the sector.
- Influence the behaviour of their portfolio organisations by making them take their online presence seriously.
However…
What’s the problem?
You may have spotted the answer to this when you saw the screenshot above. In a nutshell, those questions are rubbish.
If you’re not clear on why that is, then no worries – I’ll explain that below (at some length, as it turns out). For now, just know that the upshot is:
- There is approximately zero chance of the data resulting in any useful insights that can drive sector-wide improvements or inform policy.
- Busy people at NPOs are having their time wasted. Some aren’t aware of this, but the more digitally savvy ones know this only too well. Especially as plenty of them report on digital metrics internally and will have come up with figures that actually mean something.
- It promotes the idea that ACE don’t have a clue what they’re doing. Which is a problem, and possibly not even true.
On that last point, I’ve spoken to people who suspect that the current questions have been put down as a marker, intended to start a conversation about how things should be done. If true then it’s working – this post is proof of that – so well done. Personally, I’m not convinced. Knowingly wasting people’s precious time and making yourself look clueless is not a smart way to start a productive conversation.
I’m actually pretty sure the folks at ACE know that the information they’re collecting is rubbish. I’ve heard that plans are afoot to improve things, so hopefully this post will be outdated before too long.
For now, let’s go back to those questions and take a look at what exactly is so wrong with them.
The short version
- It’s not possible for the organisations to collect some of the information requested.
- The data doesn’t provide a sensible basis for comparison between NPOs.
- The data isn’t particularly useful in the aggregate, either.
- Some of the metrics are far too easy to game.
- The data is likely to be meaningless and unusable.
The long version
I’m going to pick through the questions one at a time.
- Number of unique browsers. This is the total number of unique devices (e.g. computers or mobile phones) that have made requests to the site in the period being measured.
This is an odd question for several reasons. For starters, browsers are not at all equivalent to devices (especialy on a mobile or tablet), but that’s not my main beef with this question. My main issue is that it’s not something anyone in their right mind would ever ask.
It’s what happens when you let your thinking be guided by the menu of metrics offered by something like Google Analytics. I bet what ACE would really like to know is ‘How many different individuals have visited the website?’. A fine question, but unfortunately not one that a website analytics package can answer reliably, due to the near impossibility of tracking users across multiple browsers devices.
Instead of recognising this and asking an answerable question they’ve gone for it anyway and still ended up falling short. Click the image below to select your choice of delightful visual metaphor.

- Number of page impressions. This is the total number of requests (e.g. mouse clicks) made for a site’s content by users of the site (i.e. unique devices) in the period being measured.
The wording of this one is all over the place. Mouse clicks do not equal page views. Users of the site do not equal unique devices (ever visited the same website on your laptop and your phone? Or borrowed someone else’s? Of course you have).
Page impressions are a useless metric anyway. A high number could indicate:
- indicate a haphazard user experience, with people getting lost and clicking around desperately.
- lots of highly engaged users who want to devour everything your website can give them.
If high numbers of pageviews are good, then websites that are happy to disregard user experience in favour of reporting ‘good news’ (to gullible advertisers or funders) can game this quite easily. With this kind of things You have to think about the effect of your incentives – if anyone took these questions seriously we’d be in all sorts of mess.
Also bear in mind that websites that have a large transactional element will typically require ticket buyers to view more pages as they select seats, view their basket, log in, add payment and delivery details and check out. That’s extra pageviews that an otherwise equivalent NPO won’t be able to count on.
Caveat time – pageviews might be useful if you’re estimating traffic load so you can provision servers properly. Even then, you’re still going to want to need to know more about the traffic profile. They might also be useful to know if you’re changing the site to improve navigation in some way. I’m pretty sure neither of those fit ACE’s reasons for collecting the data. I’m not really convinced they have a reason.
- Number of visits. A visit is a single period of activity by a unique browser.
I can see why you’d ask for this – it’s every beginners favourite metric – but, without some context, what does it actually reveal? That Website A has more visitors than Website B? Fine, but so what? By the way ‘So what?’ is a really useful follow-up question when it comes to digital metrics. If you can’t answer ‘Well, it means that we should…’ then your metric could well be meaningless.
For instance, if I were to tell you that Website A has had 2 million visits in the past 12 months and Website B has had 10 million then what does that tell you? Without context, it tells you nothing.
To labour the point, if I threw in any of these extra factoids:
- Website A does four shows a year; Website B presents 1,000.
- Website A spends £10,000/year on online advertising; Website B spends £200,000/year.
- Website A has a bounce rate of 30%; Website B has a bounce rate of 55%.
- Website A is for a touring theatre company and tickets are sold via third party venues; Website B belongs to an arts venue with it’s own ticketing system.
- Website A costs £25,000/year to maintain; Website B costs £250,000/year.
…then it would completely change how you viewed those numbers of sessions.
The wider point is, if you’re focussing on sessions with no context then you’re flying blind and would be considered a rank amateur in analytics circles.
- How much time have visitors spent on your organisation’s website (in minutes and seconds)?
Again, strangely worded. If you wanted you could easily interpret that as being a request for number of sessions x average time on site. But that’d be ridiculous.
More importantly, anyone using Google Analytics won’t be able to tell you this. Not unless they’ve tweaked their setup in a very specific way, and what are the chances of that? Yet again, it’s hard to know why ACE needs to know this or what sense to make of any particular figure – it’s the same problem as with pageviews.
- Does your website have specific content for children and young people aged 0-19 years and/or teachers?
It’s not exactly a high bar to pass, is it? I can see why you’d ask, but does anyone really answer ‘no’ to this one? What does content for young people aged 0 look like, anyway?
How to improve matters
I’ve gone on a bit there, but hopefully I’ve shown that there’s plenty of room for improvement. Here’s where I start being more constructive and stick my neck out a bit.
Off the top of my head, I think there are four options:
- Keep things as they are.
- Do nothing.
- Collect better data.
- Do something totally different.
There may well be others. If anything occurs to you then please do let me know. In the meantime, let’s pick through what I’ve come up with.
Option 1. Keep things as they are.
Just because it’s a time-wasting farce, that doesn’t mean it has to stop. After all, it’s pretty minor in the grand scheme of things and surely not the worst example of the genre. At least it means organisations dip into their website analytics once a year, so maybe some good comes of it.
I don’t like this option.
Option 2. Do nothing.
As the (variously attributed) saying goes:
Better to remain silent and be thought a fool than to speak and to remove all doubt.
The current questions are useless and working out what the right questions are might take a while. In the meantime, why waste everybody’s time? If you can’t get it right, at least don’t get it wrong.
I don’t like this option either, but I think it’s preferable to Option 1.
Option 3. Collect better data.
This is more like it. The central problem with the current questions is that they’re trying to find metrics that are applicable to a very broad group of organisations. I believe that’s a fool’s errand. For the metrics to make any sense they really need to allow for more detail.
One way to do this would be to split website functions into categories. Perhaps something like:
- Non-transactional brochure/portfolio.
- Transactional/ecommerce.
- Artistic content (interaction/consumption).
You’d then ask for metrics that are relevant to each category.
Of course, some sites will have elements of all three. Some will concentrate on just the one. Picking the right metrics for each element might still be tricky, but it’d be much more manageable. The categories might even provide some basis for meaningful comparisons between the organisations.
Having to identify those sorts of metrics might also spook the more recalcitrant organisations into putting some effort into seeing how their websites are working for them. Instead of just logging into Google Analytics login once a year and heading straight for the Audience Overview tab, they’d be forced to look at something that would actually tell them something.
It’s not a perfect solution but, done mostly right, I think it’d be better than what there is at the moment.
Option 4. Do something totally different.
Maybe the whole matter of digital metrics is a red herring. Maybe it’s not a question of collecting data after all.
Let’s take a step back for a sec and ask two important questions:
- Why is the Arts Council asking these questions in the first place?
- What does it really need to know?
Here’s a hypothesis. Maybe ACE is asking their NPOs for website stats as a way of making sure that those organisations are taking their digital presence seriously. If that’s the case then it doesn’t really matter that the questions are rubbish and the resulting data is meaningless as long as they ask something. As a result, as long as NPOs can provide some sort of answer then it shows that they too are doing something.
If so, the answer to the second question is pretty clear. The Arts Council just needs to know that the various organisations have some sort of online presence, are paying attention to how it’s performing, and are taking some appropriate steps to develop it.
In which case, why not junk the whole question of metrics and ask some better questions. For instance, any or all of the following:
- Ask organisations to report on what they’ve considered with regards to their online presence.
- Consider adopting something along the lines of the online analytics maturity model. Come to think of it, the Collections Trust recently put together something similar-ish with support from ACE.
- Ask the NPOs whether they have a digital strategy. Get them to state what progress they’ve made towards putting it into practice. I know digital strategies are much maligned (“But it should be woven into the overall organisational strategy!” I hear you cry) but it’s a tool that has uses and the process of putting one together can be valuable.
I’m sure there are others along these lines – I’d love to hear them.
A final thought about effort
I think it’s important to remember that the Arts Council’s NPOs aren’t all blessed with endless resources. Even the bigger ones are somewhat stretched, and increasing their reporting requirements unduly would be a bad thing. That’s one of the reasons I prefer Option 2 to Option 1.
That said, I like to encourage people to think of their website as they would an employee. An incredibly productive employee that works 24/7 for the benefit of multiple departments, is often the first person that an audience member will meet, who spans international boundaries and who drives costs down and revenue up.
Employees have reviews. Their progress is monitored and reviewed. By the same token, I think it’s reasonable to do that with a website, no matter the size of the organisation.
It’s also worth pointing out that using a form to collect analytics data feels a tad anachronistic. My last Arts Analytics post showed that 99% of my sample group (representing about a sixth of all NPOs) have Google Analytics on their websites. If reporting requirements were increased as per my Option 3, then it really wouldn’t be too tricky to create a tool that automated that data collection. Just a thought.
Conclusion
Well done for making it this far. For that you deserve a conclusion with a solid opinion. Unfortunately, I used to be a lawyer, so everything has to conclude with ‘it depends’. In this case, I think that:
- If ACE wants meaningful data that they can use for improvements and in advocacy they should go for Option 3.
- If ACE just wants to make sure arts organisations are keeping their eye on the ball when it comes to their online presence then go for Option 4.
- If they don’t want to do either of the above then they should do everyone a favour and go for Option 2.
I’d love to hear your thoughts and see how you might build on this or approach it differently. What do you think – am I wide of the mark? Getting close to something?