The other day I was asked how the coronavirus pandemic has impacted the business models of UK performing arts organisations.
More specifically (because obvious answer is obvious), has there been an increase in the number of digital initiatives, or have there been other important implications?
I sent back the answer below. It’s not a complete answer, and I was possibly being a bit pessimistic. Still, I thought I may as well put it here.
Here’s what I said…
There’s certainly been an increase in digital initiatives, some better thought through than others, but this comes with all sorts of caveats.
a) A lot of digital activity has been driven by an idea of public service, rather than as a way to generate income. There are some exceptions – but I don’t think any venue-based organisations are succeeding online to such a degree that they’ll want to go 100% digital from this point on. I also think there’s some evidence that the public-serving missions of arts organisations can be an obstacle to fully exploiting revenue-raising possibilities (and whether this is a good or bad thing will be a question of degree and individual philosophy).
b) Performing arts organisations have furloughed, reduced working hours, or made redundant large swathes of staff, meaning that in many cases i) there are fewer people around to work on new solutions proactively, and ii) those remaining are over-worked just trying to maintain buildings and a small level of activity, with little scope for exploiting new avenues.
c) There’s a well-documented lack of digital skills within many organisations, which may mean that opportunities aren’t executed as well as they could be, or aren’t grasped by executive teams and boards in the first place. Add to this that there’s not a lot of funding about for R&D and solutions are needed now – not 12 months down the line.
d) With the financial outlook looking bleak for some time yet, few organisations are looking to place bets on new strands of activity that might not pay off. I know of several who aren’t able to sign off on work by agencies unless there will very definitely be a positive financial return.
e) I think (too?) many organisations are thinking about how they generate activity for their existing audiences (with the aim of keeping top of mind until they can welcome them back into venues), and are failing to think about how they could/should be collaborating with others and developing cross-organisational platforms for presenting work. We’re starting to see some interesting exceptions, but not many. And compare this to companies in the commercial sector who have had to pivot a lot more urgently to stay in business.
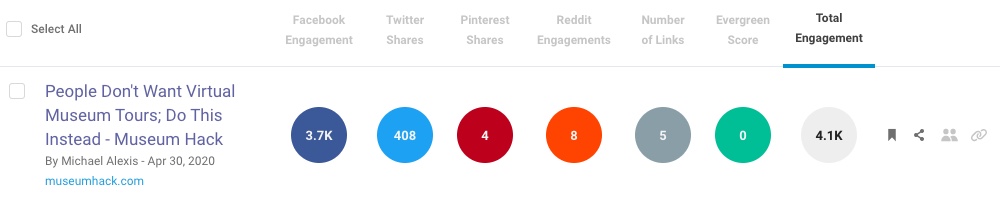
It’s very forthright, has a grabby title, and has been shared and commented on uncritically by a lot of people (certainly more than are going to share this one).
When I first started reading it I was really interested – there’s a lot of learning to be done right now about what people are looking for online, and this sort of thing is right up my street. But as I read on, well…
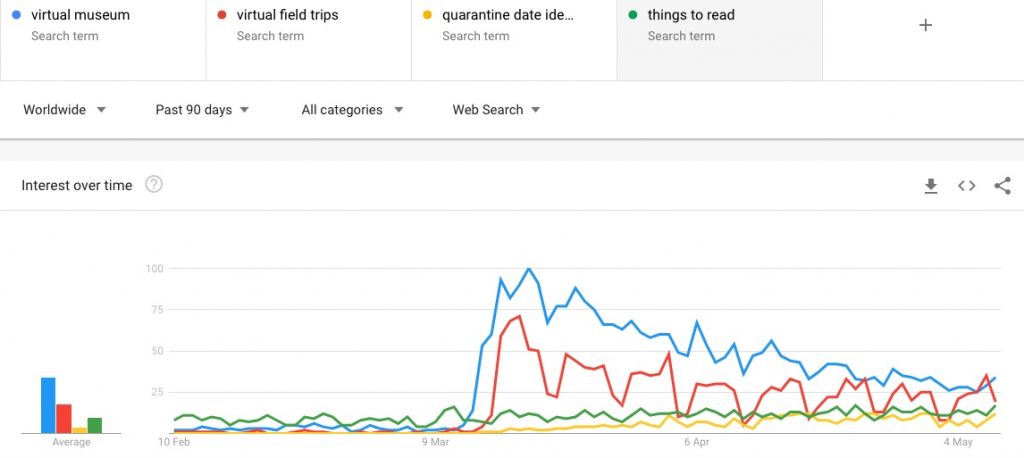
Here’s the gist of what it’s saying. While there was a big uptick in searches for virtual museum tours a few weeks back, that interest has peaked, is sharply declining, and instead the following searches are now ‘surging’:
virtual field trips for kids
quarantine date ideas
things to read
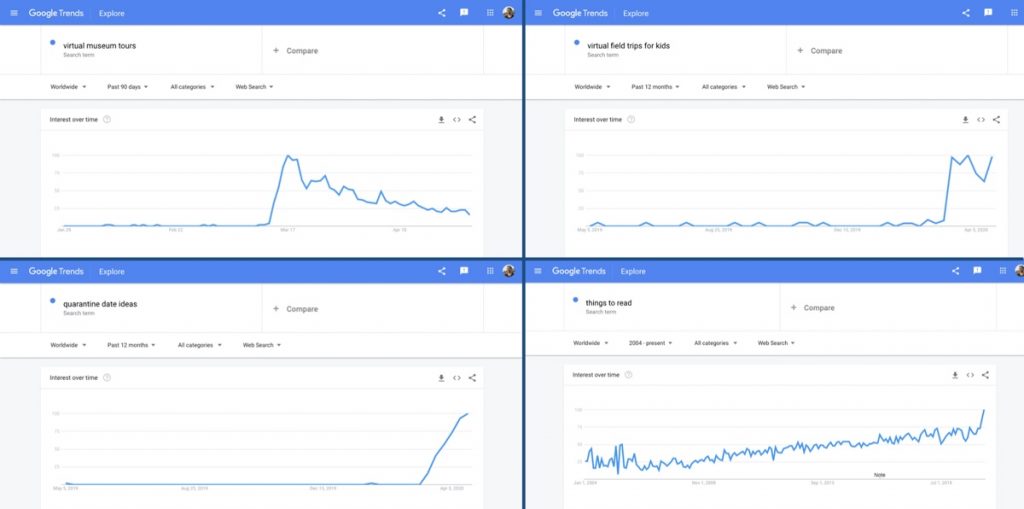
The article evidences this with charts from Google Trends showing that those search terms are now more popular than they’ve ever been.
Here they are. If you were picking a winner, which would you absolutely not pick?
Exactly, you’d tell everyone to steer clear of the one in the top left.
But those charts would also give you entirely the wrong idea about what’s happening.
All they’re doing is showing you when those terms were at their most popular over the past year. Not how popular they are overall, or in comparison to each other.
Comparing the search terms
Google Trends is only useful for relative comparisons – comparing search terms to their own past performance, and against the performance of other terms. Frustratingly, the article actually explains this critical point and then ignores it.
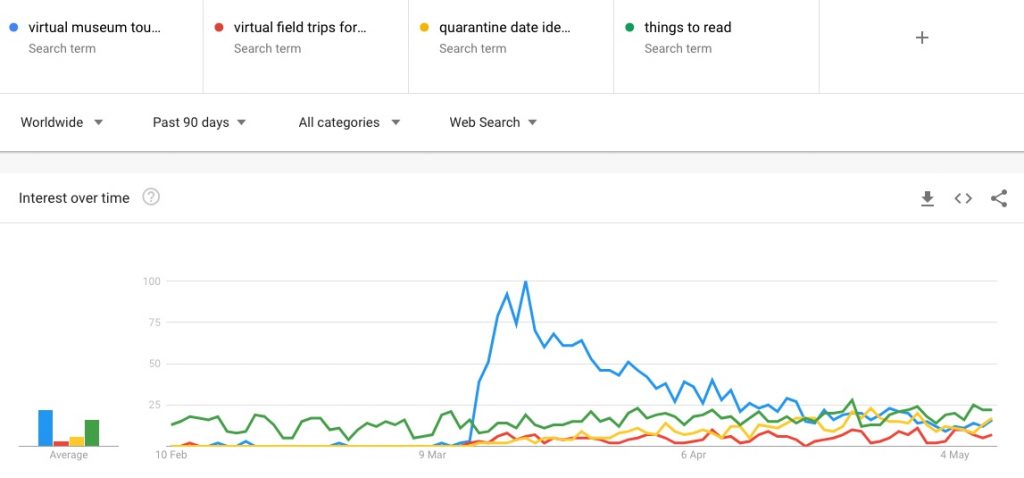
Let’s see what happens when we get Google Trends to overlay the four charts…
That’s a very different picture (sidenote: all my screenshots are as at 8 May – click the images for the latest data).
Sure, interest in ‘virtual museum tours’ exploded early on and has tailed off since, but it’s still way up from what it was, and only the incredibly generic ‘things to read’ is beating it. That may change at some point, but I wouldn’t say those other terms are exactly ‘surging’ right now.
That’s not the whole story though.
Better terms and even better topics
The next thing to fix is the choice of search terms. We nearly miss out on some very interesting insights with the ones we’re currently labouring with.
In the four original charts, Google Trends is being asked to show ‘search terms’. That means it’ll return the relative popularity of those exact words.
In which case:
Why specify virtual museum tours? Isn’t ‘virtual museum’ specific enough?
Who searches for virtual field trips for kids? Aren’t they all for kids?
We’re looking for broad trends here. If we focus on search terms that are too specific then we risk missing out on higher volume searches and the bigger picture.
Again, frustratingly, the article points out that “to a degree you still need to pinpoint an accurate search” but does nothing to solve for it.
If we tweak those two search terms the chart changes in a really interesting way.
We can immediately see that ‘virtual field trips’ is a much more popular term and has a very different pattern to it. It’s gone from trailing along the bottom of the chart to almost (but not quite) reaching ‘virtual museum’ levels of interest.
We can also see that it spiked early on and has been declining week on week ever since. Just like ‘virtual museum’.
But overall, we see that ‘virtual museum’ has been, and still is, a more popular term than any of the others (save for a brief moment on 7 May).
There’s another improvement we can make.
Picking the right search terms in Google Trends can be a pain. Sometimes there isn’t a single term that’s applicable and we want to group together different variations – singular, plural, and modifiers like ‘near me’ or ‘for kids’.
Language is an issue too. These charts have the location set to ‘worldwide’. I’m guessing not many people in Spain or India are likely to type ‘virtual museum tours’ in English (in fact, whyguess?).
Happily, we can use ‘topics’ in Google Trends to group together terms that share the same concept in any language. So let’s do that (sadly there aren’t topics for ‘quarantine date ideas’ or ‘things to read’).
There we go. We can see that ‘virtual museum’ and ‘virtual field trip’ both surged in popularity and have both declined, while still being relatively much more popular than they were before mid-March.
Would we conclude from this data that people aren’t interested in virtual museums? Or virtual field trips? Of course not.
Do people want virtual museum tours?
Yes. They’re still showing interest in the concept. For now.
Is interest growing in other terms like virtual field trips for kids, quarantine date ideas, and things to read? Not really. That doesn’t mean there’s not some interest there, but I wouldn’t bet the viability of my organisation on those particular terms.
Does everyone want to visit virtual museums? Of course not. Are they the only things people want? Don’t be daft. Why are people in the museum sector so keen on giving the concept of virtual museums a kicking? Don’t get me started.
To be absolutely fair, Museum Hack posted something of a clarification/row back…
also, maybe worth noting that "virtual museum tours" still has meaningful search volume that may extend to end of pandemic and beyond, its just on strong downward trend. thanks for including us ☀️
But nuance doesn’t get your article shared by hundreds of people who don’t think for themselves. Actually, that’s unfair – neither of us has a particular interest in torturing this data until it tells us what we want.
I should also mention that I quite like what Museum Hack are doing generally and, as much as the article irked me, I’ve only really written this because of the reaction to it.
Why not both?
Of course, contrary to the title of the original article, none of these things are mutually exclusive. With time and resource there’s no reason you couldn’t do all of these:
Create some form of virtual museum tour
Package up experiences as virtual field trips for schools. Bear in mind that ‘field trips’ is a more generic term and that’ll mean more competition
Write a blog post on quarantine date ideas that use your museum, objects, or subject matter as inspiration, AND
Publish a list of top things to read, linking back to your old posts, cross-linking to other institutions/publications, and highlighting books in your shop
Some of these things are going to be more in keeping with what a museum’s audience might expect from them. Some might be more suited to being offered by a tour company.
Although if you didn’t have the assets and processes ready to go pre-lockdown then items 1 and 2 might be tricky. Perhaps 3 and 4 are more easily do-able.
Sidenote: it’s no huge surprise that the organisations who’ve been taking digital activity seriously over the past few years are the ones who’ve been better able to adapt to the current situation.
I would also drop in a couple of caveats…
You should be informed by this data, not driven by it. Let’s not forget that the data we’re looking at here is what the worldwide population are typing in to Google:
Just because people aren’t actively searching for something, doesn’t mean that they won’t want it (search isn’t a channel for discovering new things)
If people are searching for these things then unless your content is showing up near the top of Google’s search results you won’t get much of a bump in your website traffic, and
To the extent that the data is showing what people are interested in generally (and that you can present to them through channels other than search engines), bear in mind that your audiences may not reflect the worldwide population
What else do people want?
Right now, who really knows? But I’m guessing it’s the same things they’ve always sought out. Expertise, distraction, connection, things to do, familiar things, new discoveries, a nice setting for some other activity, something to show off…
Some of those might be solved by a virtual tour of a museum, or some inventive homebound date ideas, but some won’t.
I suspect lots of people would actually quite like to visit museums but are settling for the next best thing.
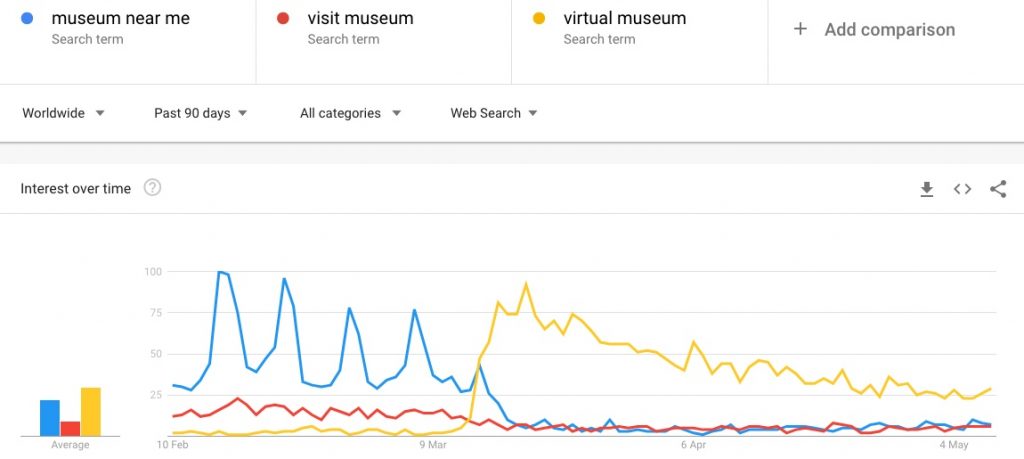
I’ll end with one last chart.
One interpretation (and we do have to be careful with this type of data) would be that people with some sort of propensity for visiting virtual museums are as interested in visiting virtual ones as they were in visiting actual ones.
In which case, rather than dismiss that interest, we should think about how best to respond to that interest, welcome people in, and make them want to tell others about their great experience.
I’ve been wanting to write something about the digital aspects of how cultural organisations have reacted to the shutdown, but…
Well, firstly, there’s just too much going on. Every ‘what if…’ thought experiment from the past twenty years is currently playing out allatonce. There’s been a flood of helpful and not so helpful prognostications (sometimes they’re one and the same think piece), and I’m wary of adding to the wrong side of that pile.
Plus I have got a toddler, a business, and a personal life to keep up with.
And anyway, in complicated situations you want to be sure that you’re asking the right questions. So here are some that have been pinging around my brain the past few weeks. Answers to some of them are forming, but I’ll try to keep those out of this for now.
Here we go…
1. With furloughs, layoffs and restricted activity kicking in at cultural orgs, what constitutes an effective skeleton crew when visitors/audiences can (temporarily?) only access them digitally? Or is the cash from the job retention scheme more important than all of that in the very short term?
2. When will more cultural organisations start collaborating (with each other, their communities, or across other sectors) whether formally or informally, rather than competing for attention in an increasingly flooded market? Interesting to see that Manchester and Bristol are ahead of the pack on this.
3. Despite early hopes for the internet being a federated or distributed system, people have tended to congregate around a few key platforms and providers. Will consolidation happen and, if so, in what areas? For instance, there might be room for an orchestra in every city, but when geography is less of an issue, then what happens? What does that mean for smaller orgs?
4. Unbundling has been another key element (think of the revenue-earning bits of local news being picked off by property websites, online classifieds, dating apps, etc). How’s that going to come into it? I’ve never thought it made much sense for hundreds of cultural organisations to toil away on their own rarely-visited educational resources.
5. Is the rush to release free content going to turn out to be a bad idea? After all, it’s generally accepted that discounting tickets should only ever be done with a very specific aim in mind. For what it’s worth, this is the one that I have the most opinions on. The answer is obviously ’it depends’ but within some reasonably knowable criteria.
6. To date, very little digital programming by cultural orgs has been expected to contribute directly to earned revenue (it usually gets a pass as innovation, marketing, or is funded in some way). I’ve long suspected this is why it’s not taken particularly seriously and tends to be a bit flabby. With a lack of business model, is a rush to do more of this stuff going to be a drain on organisations that can no longer subsidise it through other activity?
7. Is the requirement to have an easily deployable ‘shutdown mode’ going to become a standard feature of website briefs?
8. What are the new (or existing but underserved) attention patterns that organisations can/should adapt to? Fewer people are commuting, and nobody has to rush for the last train home. So for live events, what are the good times for communal activities?
9. Similarly, you can play/take liberties with an audience’s attention when they’ve paid money, come to your building, are sat in a dark room, and social pressure is preventing them from getting their phone out. When they’re sat at home on their laptop or mobiles with work, children, or Candy Crush vying for their time, how’s that 4.5 hour performance looking then?
10. Art has often/always been shaped by its canvas (or played against it). What are the emerging formats? Which existing ones translate well digitally, and which don’t? Put another way, if people can’t come to an exhibition, would it still make sense to put paintings on the walls of a gallery and then walk around filming them? What achieves the ‘point’ of an exhibition (insert other analogue presentational format) but uses the affordances of digital media?
11. People complain about live performance not translating to digital (ie screen) media very well. But why is that usually framed as being the fault of digital media, rather than the inability of the thing to adapt from one space to another? I’ll answer this one quickly, because it’s not a particularly new question. The only real faults here are in the facile criticism, and a lack of imagination used when translating something from one setting to another.
12. Again, not a new question, but have some artforms become over-specialised to the extent that they can only thrive in certain conditions (high capacity venues, corporate support, and tonnes of public funding)? Have they been encouraged to become giant pandas (which, don’t get me wrong, I’m a fan of) when it’s the foxes that’ll thrive right now?
13. For a simple rule of thumb to use as a guide to which organisations are likely to thrive and which are more struggle, how about seeing how many people in positions of influence are aware and open to digital possibilities, versus those who complain that it’s not the same as the ‘real’ thing?
14. More of a comment than a question (ugh), but this could’ve been consumer VR’s moment.
And the ones that I’m really interested in…
15. Which cultural organisations are going to come out of this situation well? What are their characteristics? What have they been doing over the past few years? What are they doing now? Who are the people responsible for leading and executing on their plans? Were they hired in or trained up?
16. If/when things return to ’normal’ how many organisations will carry on with some/all of what they’ve been doing over the past few weeks?
17. Will that happen before organisations are really forced to consider longer term changes in order to stay operational? And what does ‘operational’ look like then?
Maybe one day I’ll get the time to write some thoughts down on some of these.