This year there have been a few websites and projects aimed at presenting online (and offline) statistics relating to museums. These are the ones I’ve seen, in chronological order. There may well be more, so if I’ve missed any good ones then let me know.
When Should I Visit? was made at Culture Hack London in January 2011 by Dan Williams. It uses check-in data from Foursquare to find the least busy time to visit the museums, galleries and theatres of London.
There have been other interesting things made at Culture Hacks over the year but this one stuck in the mind.
In April, Jim Richardson tweeted about having a spreadsheet of 1500+ museums on Twitter. This sparked a collaborative project with lots of others chipping in to extend and improve his data. The spreadsheet doesn’t seem to be accessible at the moment but no matter, it got a good amount of attention while it was around.
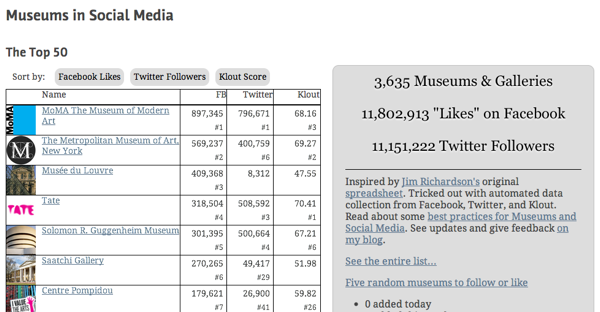
Sean Redmond, a web developer at the Guggenheim, took that spreadsheet and created Museums in Social Media. He added Facebook data and presented the information in a nice table. He’s also blogged about the process.
Skip on a few months to August when the Let’s Get Real report was published. I’ve mentioned that one on this blog plenty enough by now so won’t go on about it here. I should give Museum Stats a mention at this point. It was referenced in that report but, what with it being in closed Alpha at the moment and me not being a museum, I have no idea what’s going on there.
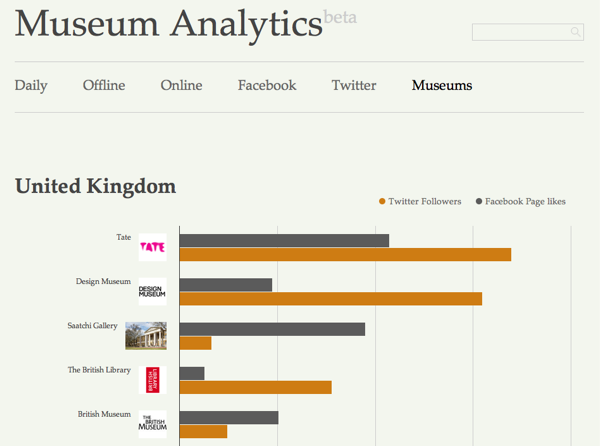
Which brings us to Museum Analytics, recently unveiled by INTK in the Netherlands. It’s:
an online platform for sharing and discussing information about museums and their audiences. For each museum there is a daily updated report with information about online and offline audiences.
I’m not quite sure how they’re getting all the information (although there is an about page which explains a little) but it’s nicely put together and they’re talking about it extending it further. You can look at stats for each venue, country and online platform. You can even order a regular report to be emailed to you.
The pattern for these things goes:
- Someone makes data available (Foursquare, Jim Richardson & co, Let’s Get Real partners, etc)
- Someone does something with that data (Dan Williams, Culture 24, Sean Redmond, INTK)
The variety of things that can be built will only increase as the raw materials (lots of good sources of data) become more widely available. Whether the things that are made are insightful, arty, actionable, profitable, funny or otherwise will depend on the person building it and what their motivations are. The more the merrier, I say.


Comments are closed.